Contents
Intro
In Prometheus, PostGIS and Phoenix Part 1 we covered what exactly monitoring is and what are its benefits. We also put together the foundation for our application that we will be monitoring with Prometheus and Grafana. In the final part of this series, we’ll be setting up our monitoring stack, instrumenting our application, and writing a simple stress tester to make our graphs dance. Part 2 assumes that you have already gone through Part 1 and have the code and database at a point where we can jump right in. If you want to checkout the companion code and fast forward to this point, do the following:
$ git clone https://github.com/akoutmos/elixir_monitoring_prom.git
$ cd elixir_monitoring_prom
$ git checkout 070bee0ad72a594fe230c197f560c39c0c4c5b01
Without further ado, let’s dive right into things!
Step 5: Add Prometheus & Grafana to Docker Compose - commit
With our application functioning and returning results for queries, it’s time for us to shift our focus to our Docker Compose file so that we can add some monitoring related services. Specifically, we’ll need to add 3 services:
- Prometheus: At its core, Prometheus is a time series database. You configure Prometheus to scrape various sources at a particular interval, and the data that it fetches at each of those intervals makes up your time series data. It is important to note here that Prometheus is a “pull” type monitoring solution. In other words, it reaches out to its configured sources and requests data. Naturally the other monitoring type is “push” and that works by applications pushing their metrics to a database. Discussing the pros and cons of push versus pull is out of scope for this post but feel free to read [2] for more information.
- Postgres Exporter: In order for Prometheus to fetch metrics from a particular source, it needs an HTTP endpoint to
hit which will expose said metrics. Naturally, Postgres does not expose metrics in the Prometheus supported format as
it should not be coupled to any one particular monitoring tool. This is where the Postgres Exporter comes in. The
Postgres Exporter will fetch metrics out of Postgres, and will then expose a
/metricsendpoint which Prometheus can scape. In other words, the Exporter acts as the intermediary between Postgres and Prometheus. You will actually see this pattern a lot in the Prometheus ecosystem. There are exporters for RabbitMQ, MongoDB, CouchDB, Consul and many more services (see [3] for more information). - Grafana: Grafana is a tool which you can use to setup dashboards and visualize the time series data that is in Prometheus (it is of course not limited to only Prometheus and can also query InfluxDB, Loki, Graphite and many other data sources). You can also use Grafana to issue alerts when metrics surpass certain thresholds to proactively address issues as they occur.
Now that we have some background as to the tools that we will be using, let’s dive right in and add some additional
entries to our docker-compose.yml file. We’ll add to our services and volumes in our docker-compose.yml file as
follows:
version: '3.7'

services:
  ...

  grafana:
    image: grafana/grafana:6.3.3
    depends_on:
      - prometheus
    ports:
      - '3000:3000'
    volumes:
      - grafana-data:/var/lib/grafana
      - ./docker/grafana/:/etc/grafana/provisioning/
    env_file:
      - ./docker/grafana/.env

  prometheus:
    image: prom/prometheus:v2.11.2
    ports:
      - '9090:9090'
    volumes:
      - ./docker/prometheus/:/etc/prometheus/
      - prometheus-data:/prometheus
    command:
      - '--config.file=/etc/prometheus/config.yml'
      - '--storage.tsdb.path=/prometheus'
      - '--web.console.libraries=/usr/share/prometheus/console_libraries'
      - '--web.console.templates=/usr/share/prometheus/consoles'

  postgres_exporter:
    image: wrouesnel/postgres_exporter:v0.5.1
    ports:
      - '9187:9187'
    depends_on:
      - postgres
    environment:
      DATA_SOURCE_USER: postgres
      DATA_SOURCE_PASS: postgres
      DATA_SOURCE_URI: postgres:5432/?sslmode=disable

volumes:
  ...

  prometheus-data: {}
  grafana-data: {}
You’ll probably notice that there are some references to a ./docker/... directory in the docker-compose.yml service
volumes sections. I won’t go too far into the details of how I put together the Prometheus & Grafana configurations as
that could be an article of its own. So for now, feel free to copy the docker directory directly into your project (if
you do want me to deep dive into Prometheus & Grafana provisioning/configuration leave a comment below :)). The docker
directory contents can be found here: https://github.com/akoutmos/elixir_monitoring_prom/tree/master/docker. After this
step, your top level directory tree should look something like this:
$ tree -L 1
.
├── _build
├── config
├── deps
├── docker
├── docker-compose.yml
├── lib
├── mix.exs
├── mix.lock
├── priv
├── README.md
└── test
With the docker-compose.yml file up to date and our new monitoring services in place, running docker-compose up
should bring up all the containers. If all goes well, you should be able to go to http://localhost:3000 where you will
find Grafana (username: admin, password: admin)! If you navigate to the Postgres Stats dashboard you should
see some pretty graphs and stats:
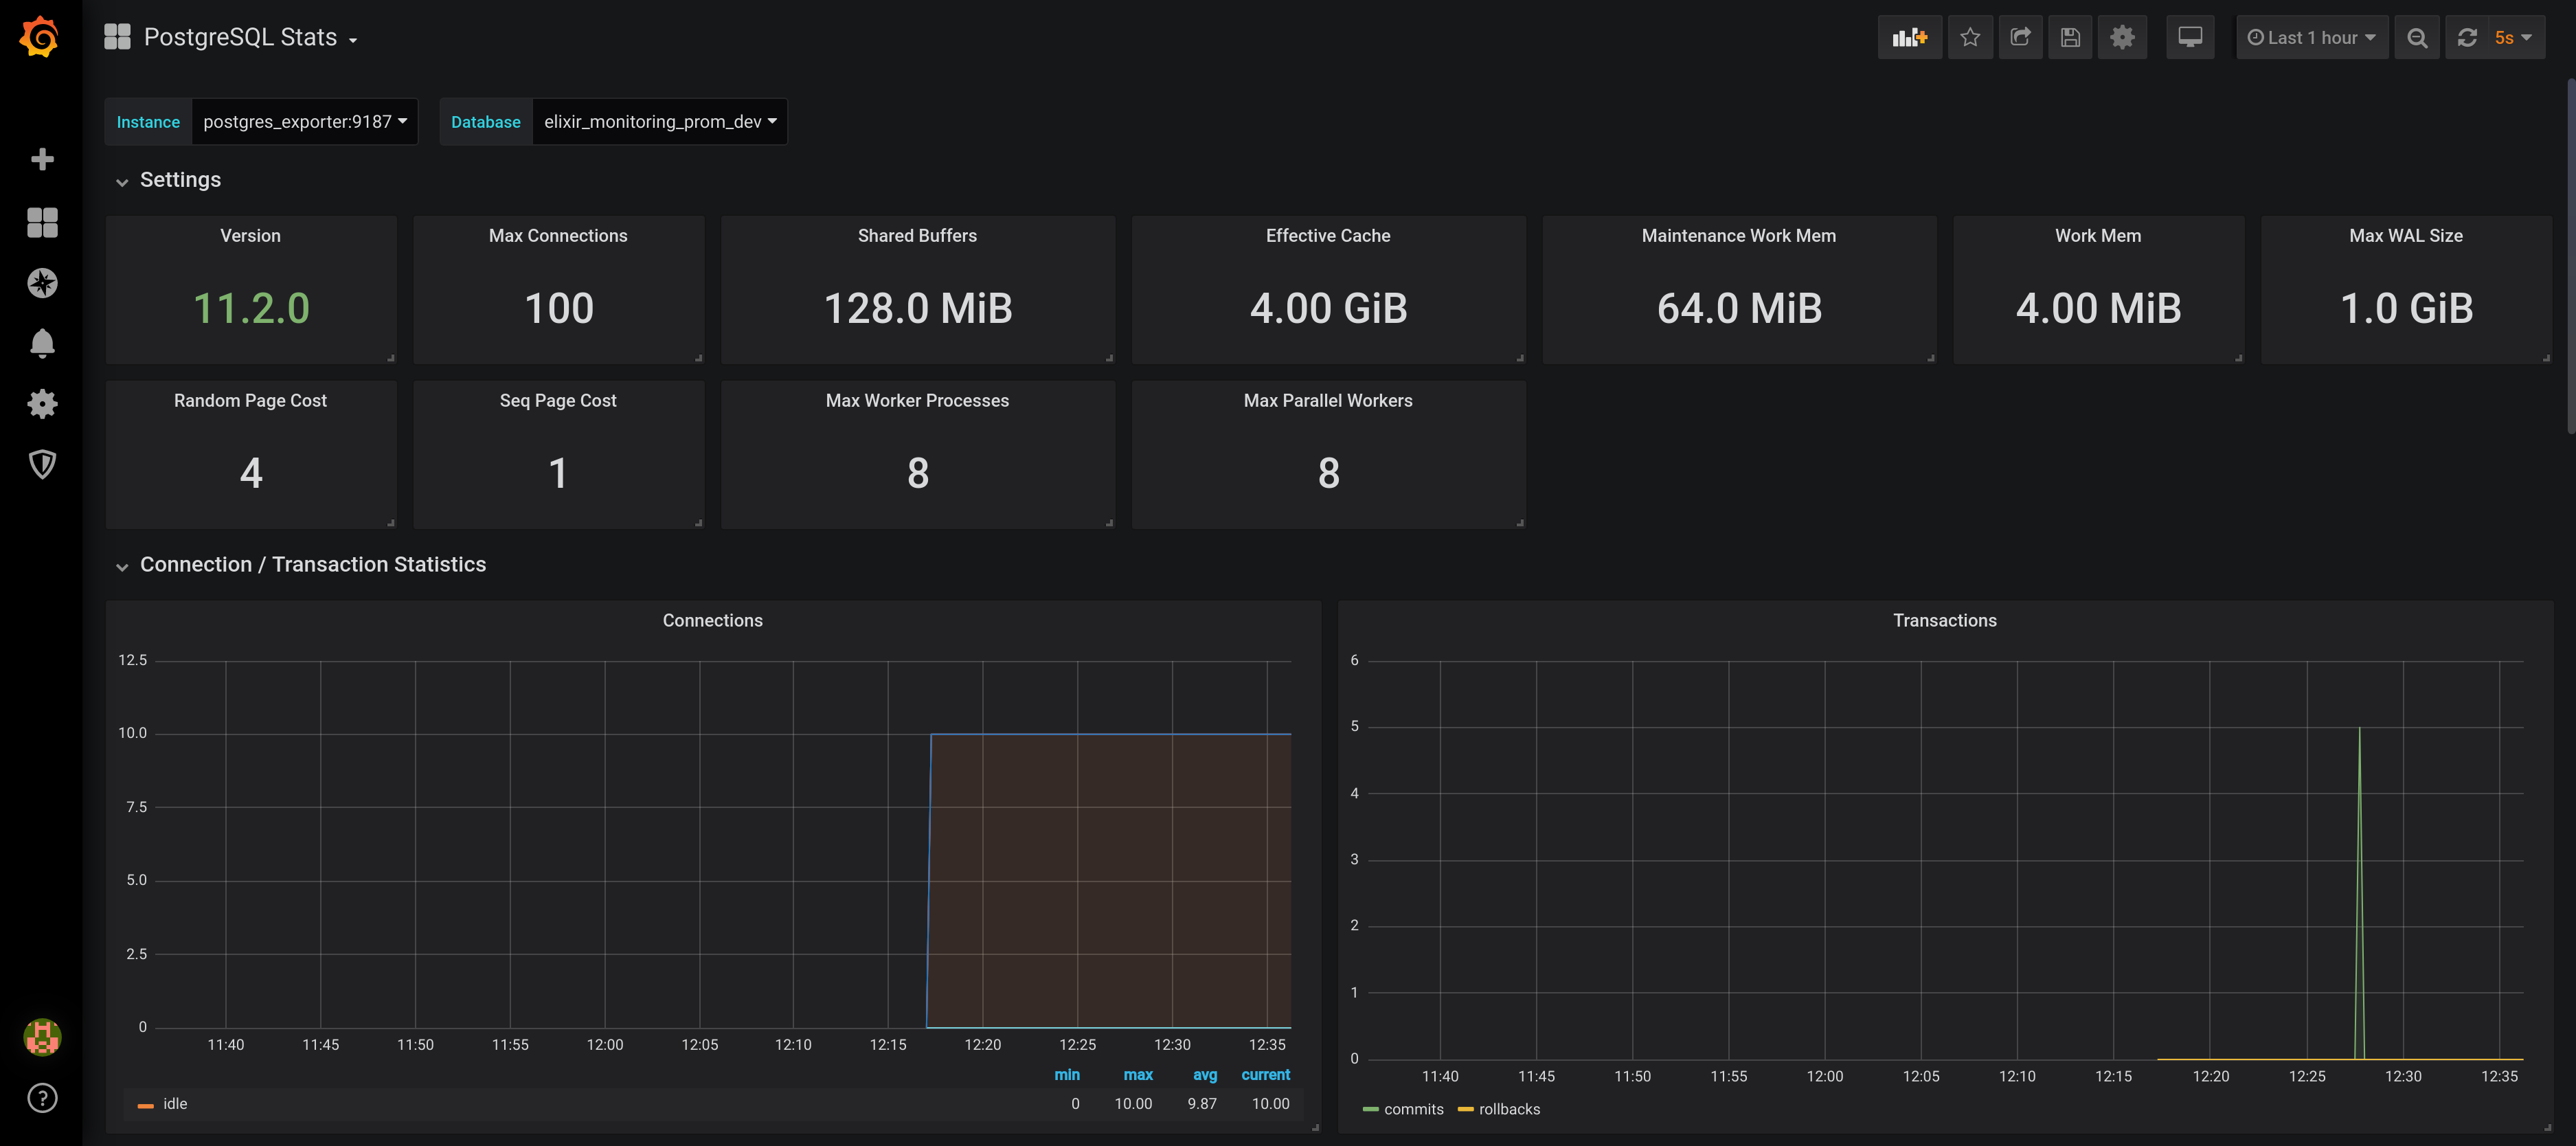
While the Postgres dashboard has data available to display, the remaining dashboards are empty :(. The reason
for this is that our Phoenix app is not exposing a metrics endpoint at /metrics for Prometheus to scrap. In fact if
you look at the Docker Compose logs, you see that Prometheus is trying to scrape our application, but our app is
returning a 404:
[debug] ** (Phoenix.Router.NoRouteError) no route found for GET /metrics (ElixirMonitoringPromWeb.Router)
    (elixir_monitoring_prom) lib/phoenix/router.ex:324: ElixirMonitoringPromWeb.Router.call/2
    (elixir_monitoring_prom) lib/elixir_monitoring_prom_web/endpoint.ex:1: ElixirMonitoringPromWeb.Endpoint.plug_builder_call/2
    (elixir_monitoring_prom) lib/plug/debugger.ex:122: ElixirMonitoringPromWeb.Endpoint."call (overridable 3)"/2
    (elixir_monitoring_prom) lib/elixir_monitoring_prom_web/endpoint.ex:1: ElixirMonitoringPromWeb.Endpoint.call/2
    (phoenix) lib/phoenix/endpoint/cowboy2_handler.ex:40: Phoenix.Endpoint.Cowboy2Handler.init/2
    (cowboy) /app/deps/cowboy/src/cowboy_handler.erl:41: :cowboy_handler.execute/2
    (cowboy) /app/deps/cowboy/src/cowboy_stream_h.erl:296: :cowboy_stream_h.execute/3
    (cowboy) /app/deps/cowboy/src/cowboy_stream_h.erl:274: :cowboy_stream_h.request_process/3
    (stdlib) proc_lib.erl:249: :proc_lib.init_p_do_apply/3
Let’s fix this in the next step by instrumenting our application! You can kill the Docker Compose stack for now as we’ll
need to add additional dependencies and update the mix.exs + mix.lock files (the Elixir service only fetches new
dependencies on container startup).
Step 6: Instrument Phoenix application - commit
Let’s add a couple of dependencies to our project (a huge thanks to deadtrickster for all his hard work on the Elixir Prometheus libraries https://github.com/deadtrickster):
defp deps do
  [
    ...
    {:prometheus, "~> 4.4.1"},
    {:prometheus_ex, "~> 3.0.5"},
    {:prometheus_ecto, "~> 1.4.3"},
    {:prometheus_phoenix, "~> 1.3.0"},
    {:prometheus_plugs, "~> 1.1.5"},
    {:prometheus_process_collector, "~> 1.4.3"}
  ]
end
After running mix deps.get on the host machine, we can get to work configuring our Phoenix app to utilize these new
dependencies. Let start by creating a file lib/instrumenters.ex. The instrumenters defined within this file will allow
us to take metrics on Phoenix, Ecto, and Plug internals. Within that file put the following (feel free to split this up
into different files, I just find it easier to have all the Prometheus related instrumenters in the same place):
defmodule ElixirMonitoringProm.PhoenixInstrumenter do
  @moduledoc "Prometheus instrmenter for Phoenix"

  use Prometheus.PhoenixInstrumenter
end

defmodule ElixirMonitoringProm.PipelineInstrumenter do
  @moduledoc "Prometheus instrmenter for Phoenix"

  use Prometheus.PlugPipelineInstrumenter
end

defmodule ElixirMonitoringProm.RepoInstrumenter do
  @moduledoc "Prometheus instrmenter for Phoenix"

  use Prometheus.EctoInstrumenter
end

defmodule ElixirMonitoringProm.PrometheusExporter do
  @moduledoc "Prometheus instrmenter for Phoenix"

  use Prometheus.PlugExporter
end
With that in place, let’s turn our attention to lib/elixir_monitoring_prom/application.ex and initialize the
instrumenter supervisors and hook into the Ecto telemetry events (when using Ecto 3.1+). Within the start/2 function add the following lines:
def start(_type, _args) do
  # Start all the instrumenters
  ElixirMonitoringProm.PhoenixInstrumenter.setup()
  ElixirMonitoringProm.PipelineInstrumenter.setup()
  ElixirMonitoringProm.RepoInstrumenter.setup()
  ElixirMonitoringProm.PrometheusExporter.setup()

  # NOTE: Only for FreeBSD, Linux and OSX (experimental)
  # https://github.com/deadtrickster/prometheus_process_collector
  Prometheus.Registry.register_collector(:prometheus_process_collector)

  :telemetry.attach(
    "prometheus-ecto",
    [:elixir_monitoring_prom, :repo, :query],
    &ElixirMonitoringProm.RepoInstrumenter.handle_event/4,
    nil
  )

  ...
end
Now that the instrumenter supervisors are initialized, we’ll need to hook into the Phoenix plug chain in endpoint.ex
so that we can expose our /metrics endpoint to Prometheus and so that we can also take metrics on the various calls
coming into our API. At the bottom of lib/elixir_monitoring_prom_web/endpoint.ex but before
plug ElixirMonitoringPromWeb.Router add the following:
defmodule ElixirMonitoringPromWeb.Endpoint do
  ...

  # Creates the /metrics endpoint for prometheus & collect stats
  plug ElixirMonitoringProm.PrometheusExporter
  plug ElixirMonitoringProm.PipelineInstrumenter

  ...
end
We also need to hook into Phoenix’s builtin instrumentation hooks
(https://hexdocs.pm/phoenix/Phoenix.Endpoint.html#module-instrumentation) and configure the metrics collection. To do
so, open up config/config.exs and update the following entry (as a side note, please don’t ever commit your secret_key_base to source control…this is just a tutorial and thus I get a pass :)):
# Configures the endpoint
config :elixir_monitoring_prom, ElixirMonitoringPromWeb.Endpoint,
  ...
  instrumenters: [ElixirMonitoringProm.PhoenixInstrumenter]

config :prometheus, ElixirMonitoringProm.PipelineInstrumenter,
  labels: [:status_class, :method, :host, :scheme, :request_path],
  duration_buckets: [
    10,
    100,
    1_000,
    10_000,
    100_000,
    300_000,
    500_000,
    750_000,
    1_000_000,
    1_500_000,
    2_000_000,
    3_000_000
  ],
  registry: :default,
  duration_unit: :microseconds

  ...
Finally, the last update we will make is to lib/instrumenters.ex. Without this change, our http_requests_total
counter (a metric collected by the Prometheus libraries we pulled down) will not have the correct endpoint path for the
requests coming in. To fix this, open up lib/instrumenters.ex and update the
ElixirMonitoringProm.PipelineInstrumenter module so it looks like this:
defmodule ElixirMonitoringProm.PipelineInstrumenter do
  @moduledoc "Prometheus instrmenter for Phoenix"

  use Prometheus.PlugPipelineInstrumenter

  def label_value(:request_path, conn) do
    case Phoenix.Router.route_info(
           ElixirMonitoringPromWeb.Router,
           conn.method,
           conn.request_path,
           ""
         ) do
      %{route: path} -> path
      _ -> "unkown"
    end
  end
end
With all these changes in place, bring up the Docker Compose stack with docker-compose up and run the following in
another terminal to perform a quick and dirty stress test (do this in 2 separate terminals or run docker-compose up -d
to run in the background as done in Part 1 - Step 4):
# We'll pipe to /dev/null since we don't really care about the output at the moment
$ curl -s "http://localhost:4000/api/breweries?zip_code=98052&mile_radius=[1-100]" > /dev/null
After running that command, if you make a request to http://localhost:4000/metrics (either via curl or in the
browser), you should see the raw metrics that your application is exposing. For example, here are some of the metrics
that you will see after running the previous curl stress test:
# TYPE http_requests_total counter
# HELP http_requests_total Total number of HTTP requests made.
http_requests_total{status_class="success",method="GET",host="localhost",scheme="http",request_path="/api/breweries"} 100
# TYPE phoenix_channel_receive_duration_microseconds histogram
# HELP phoenix_channel_receive_duration_microseconds Phoenix channel receive handler time in microseconds
# TYPE phoenix_controller_call_duration_microseconds histogram
# HELP phoenix_controller_call_duration_microseconds Whole controller pipeline execution time in microseconds.
phoenix_controller_call_duration_microseconds_bucket{action="index",controller="ElixirMonitoringPromWeb.BreweryController",le="10"} 0
phoenix_controller_call_duration_microseconds_bucket{action="index",controller="ElixirMonitoringPromWeb.BreweryController",le="25"} 0
phoenix_controller_call_duration_microseconds_bucket{action="index",controller="ElixirMonitoringPromWeb.BreweryController",le="50"} 0
phoenix_controller_call_duration_microseconds_bucket{action="index",controller="ElixirMonitoringPromWeb.BreweryController",le="100"} 0
phoenix_controller_call_duration_microseconds_bucket{action="index",controller="ElixirMonitoringPromWeb.BreweryController",le="250"} 0
phoenix_controller_call_duration_microseconds_bucket{action="index",controller="ElixirMonitoringPromWeb.BreweryController",le="500"} 0
phoenix_controller_call_duration_microseconds_bucket{action="index",controller="ElixirMonitoringPromWeb.BreweryController",le="1000"} 0
phoenix_controller_call_duration_microseconds_bucket{action="index",controller="ElixirMonitoringPromWeb.BreweryController",le="2500"} 2
phoenix_controller_call_duration_microseconds_bucket{action="index",controller="ElixirMonitoringPromWeb.BreweryController",le="5000"} 16
phoenix_controller_call_duration_microseconds_bucket{action="index",controller="ElixirMonitoringPromWeb.BreweryController",le="10000"} 54
phoenix_controller_call_duration_microseconds_bucket{action="index",controller="ElixirMonitoringPromWeb.BreweryController",le="25000"} 99
phoenix_controller_call_duration_microseconds_bucket{action="index",controller="ElixirMonitoringPromWeb.BreweryController",le="50000"} 99
phoenix_controller_call_duration_microseconds_bucket{action="index",controller="ElixirMonitoringPromWeb.BreweryController",le="100000"} 100

...
The output you see here from hitting the /metrics endpoint is what Prometheus will scrape every 5 seconds (or however
many seconds you configured in your docker/prometheus/config.yml file). Without getting too far into Prometheus as
that is a huge topic on its own, each one of these entries in the output is effectively its own timeseries data point
that Prometheus will track over time for you. Prometheus has several data types that it supports, each with its own
particular type of data that it is meant to capture [8]. If this is something you would like me to deep dive into, feel
free leave me a message below and I see what I can put together :).
With everything in place, it is now time to create a stress tester that we can run in order to make our pretty graphs do shinny things!
Step 7: Write a stress test tool - commit
Now that everything is in place and working as expected, it is time to throw together a quick and dirty stress tester
and hammer the backend service to make those graphs dance! At the root of your project, create a file called
stress_test.exs. Within that file, add the following (feel free to change the values up at the top and adjust the
stress tester as you desire):
wait_time_per_query_ms = 75
number_of_queries = 1..10_000
miles_to_search = 1..50

valid_zips =
  "#{__DIR__}/priv/repo/wa_zip_codes.csv"
  |> File.read!()
  |> String.split("\n")
  |> Enum.filter(fn line -> String.trim(line) != "" end)
  |> Enum.map(fn csv_line ->
    [zip, _city, _state, _lat, _long, _tz, _dst] =
      csv_line
      |> String.replace("\"", "")
      |> String.replace("\n", "")
      |> String.split(",")

    zip
  end)

:inets.start()

Enum.each(number_of_queries, fn count ->
  radius = Enum.random(miles_to_search)
  zip = Enum.random(valid_zips)

  url =
    String.to_charlist(
      "http://localhost:4000/api/breweries?zip_code=#{zip}&mile_radius=#{radius}"
    )

  :httpc.request(:get, {url, []}, [], [])

  if rem(count, 100) == 0, do: IO.puts("Made #{count} zip code requests")

  :timer.sleep(wait_time_per_query_ms)
end)
The idea with the stress tester is to get a wide range of requests put together so we can see real world performance and
not send the same request over and over again (triggering DB cache). In order to run the stress test application, run
the following in the terminal while your Docker Compose stack is running in the background (if it isn’t already running,
use docker-compose up):
$ elixir stress_test.exs
Made 100 zip code requests
Made 200 zip code requests
Made 300 zip code requests
...
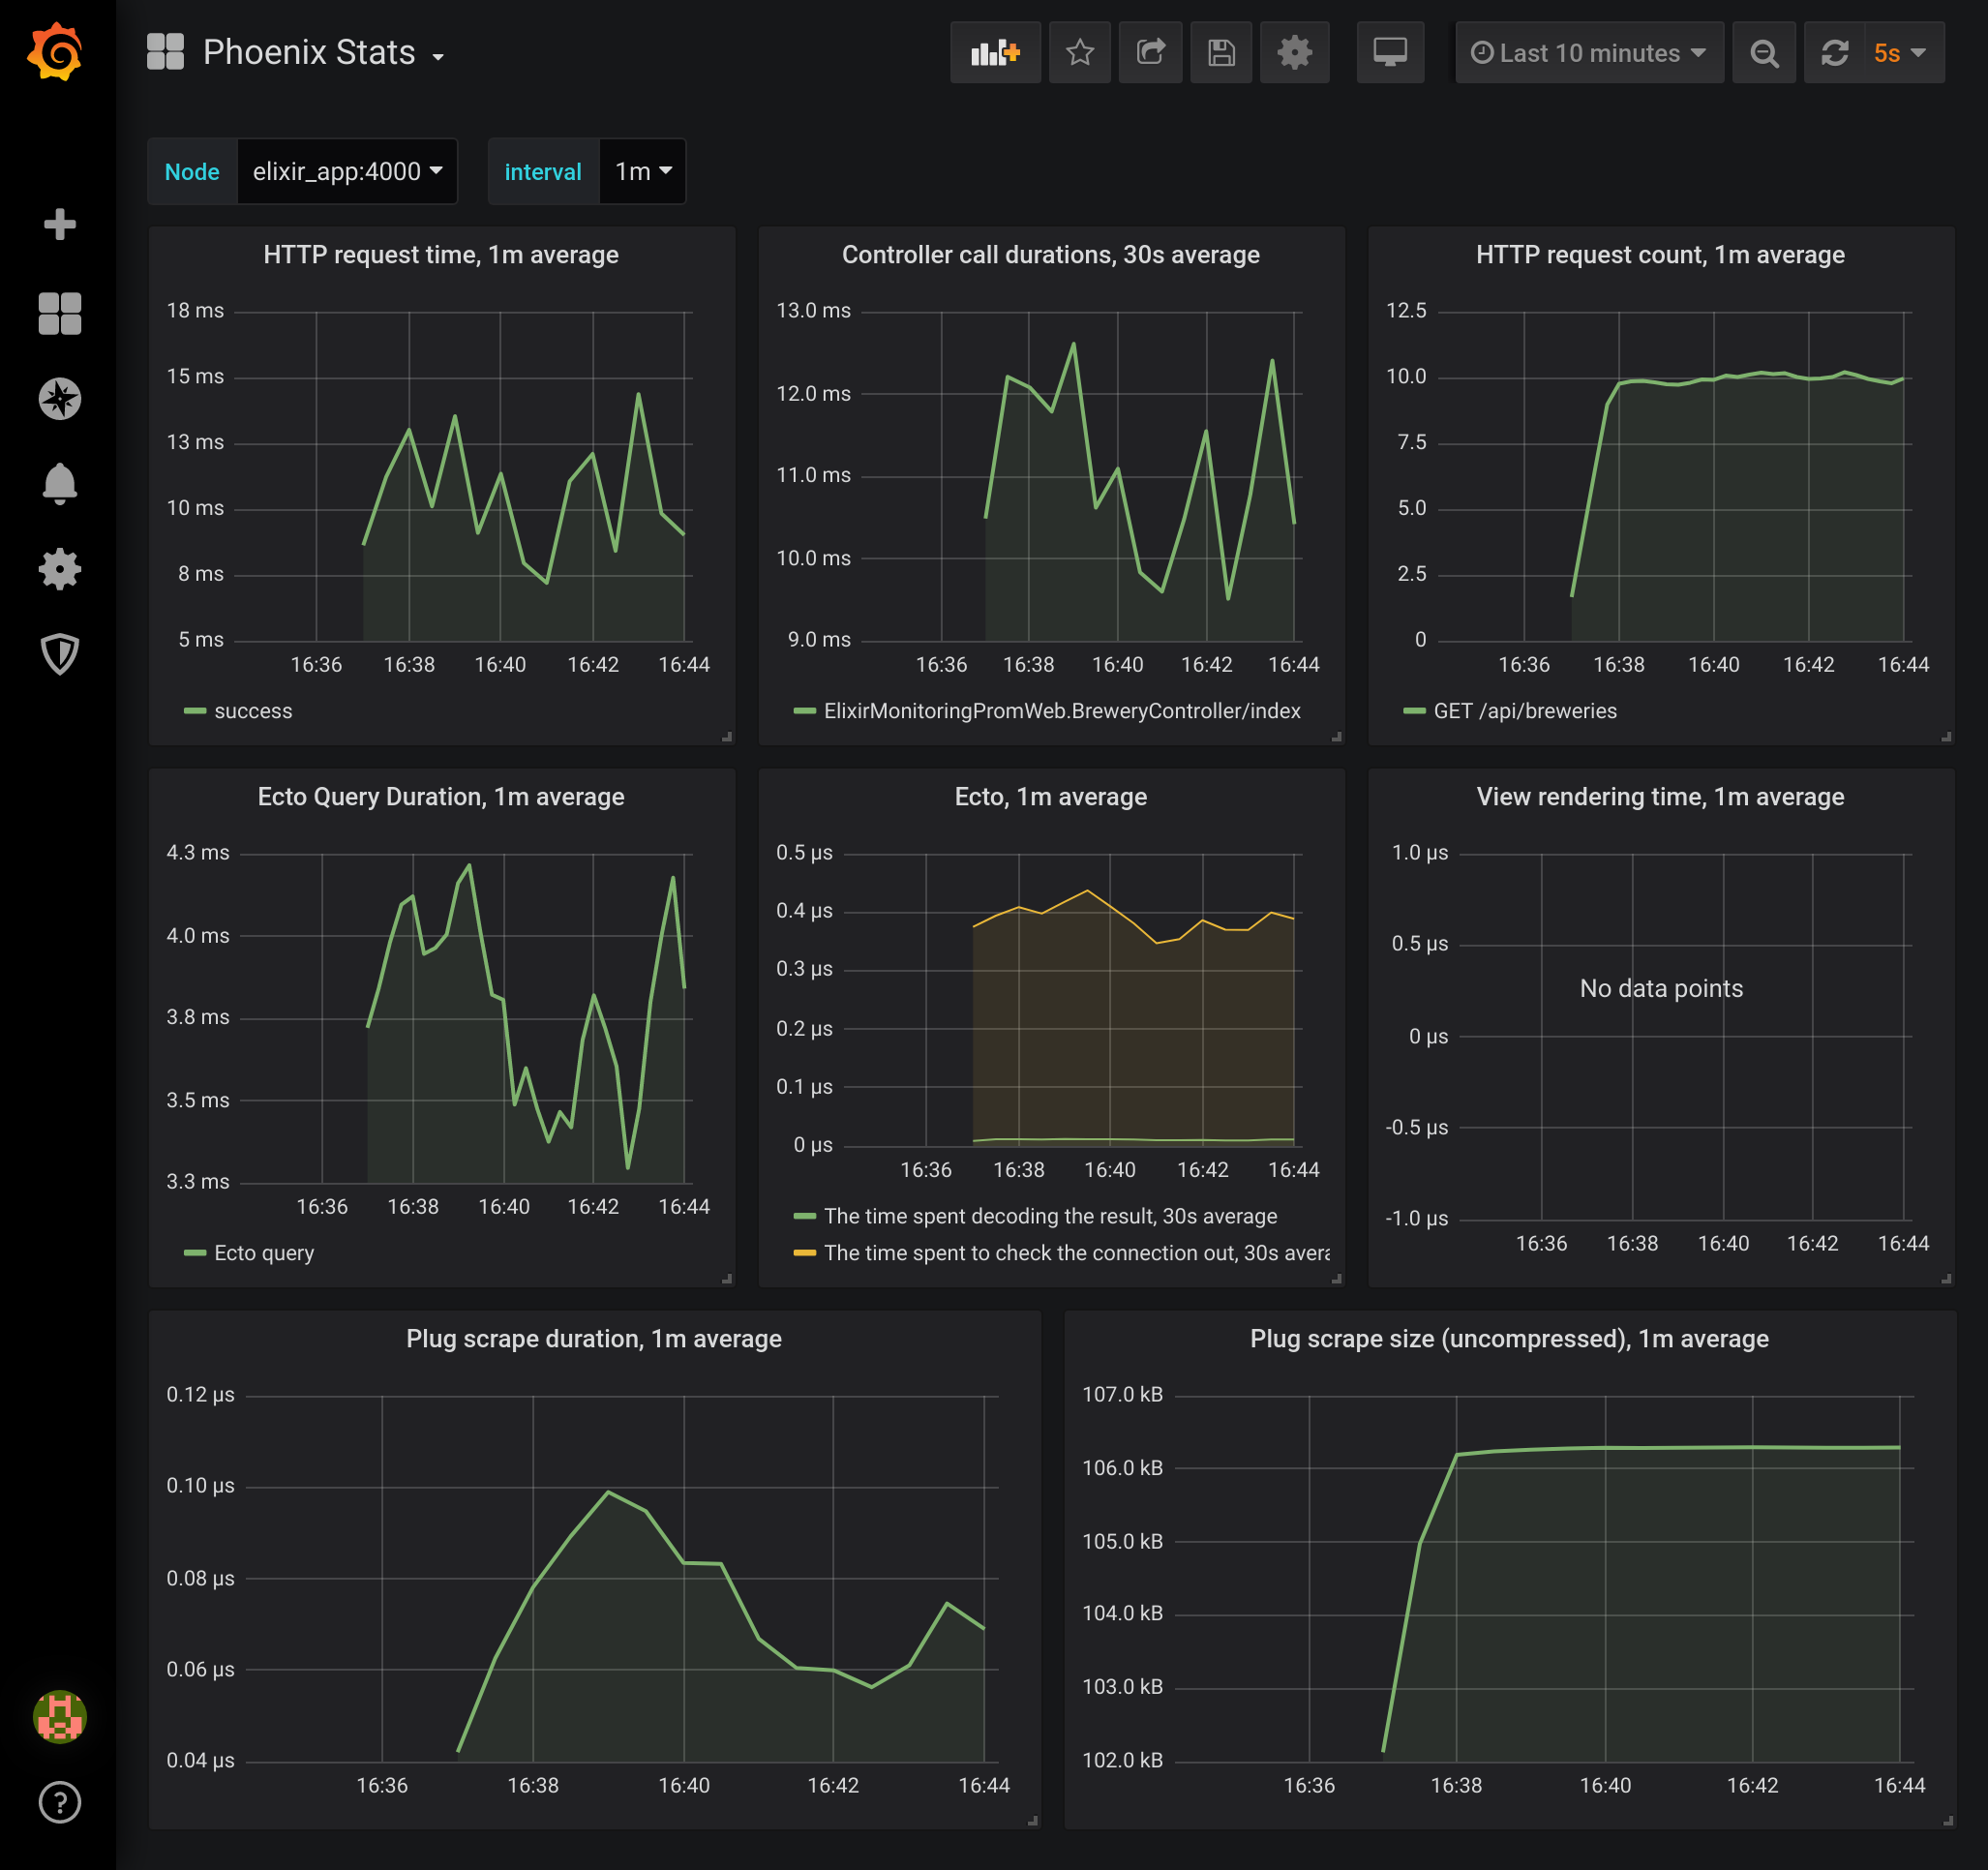
With the stress tester running in the background now, we can log into our Grafana server and see how our application and
services are handling the load. If you navigate to http://localhost:3000 and then view the Phoenix Stats dashboard,
you can see the statistics for how long HTTP requests are taking and how long the DB requests are taking. You can also
navigate to the PostgreSQL Stats and BEAM Stats dashboards and see how the database and BEAM are behaving under
load.
Step 8: Adding additional metrics - commit
A monitoring system isn’t terribly useful if we can’t also add our own metrics that we would like to keep track of. For example, if the business side of the operation wanted to know how your users are interacting with your system, giving them stats on the BEAM isn’t going to give them much information. Luckily, using the libraries we pulled into our project, we can create our own metrics and visualize them in Grafana. For this effort we’ll be creating two metrics:
- A counter for zip codes so we can keep track of which zip codes are the most popular to search out of.
- A histogram where we can keep track of what are the most common radius queries that we receive.
These types of metrics can help business people quantify various hypotheses about the customer base and how the
application/service is being used. This in turn will allow the business to make data driven decisions. To get started
adding the aforementioned metrics to our application, we’ll need to create a new file at lib/metrics.ex (you can
really create this file anywhere, and often times I actually have a Phoenix Context named metrics where all my metrics
reside). Within lib/metrics.ex add the following:
defmodule ElixirMonitoringProm.Metrics do
  use Prometheus.Metric

  alias ElixirMonitoringProm.{ZipCode, ZipCodes.ZipCode}

  def setup do
    # Our counter for the number of searches against a particular zipcode.
    # Given that there is a label 'geohash' each zip code gets its own counter.
    Counter.new(
      name: :elixir_app_zip_code_search,
      help: "Counter for brewery zip code searches",
      labels: [:zip_code, :geohash]
    )

    # The provided radius will fall into one of the defined buckets
    Histogram.new(
      name: :elixir_app_radius_search,
      buckets: [1, 2, 5, 10, 20, 50],
      help: "The radius that people are searching within for breweries"
    )
  end

  def increment_zip_code_search(zip_code) do
    zip_code
    |> ElixirMonitoringProm.ZipCodes.get_zip_code_info()
    |> case do
      %ZipCode{point: %Geo.Point{coordinates: {long, lat}}} ->
        geo_hash = Geohash.encode(lat, long)
        Counter.inc(name: :elixir_app_zip_code_search, labels: [zip_code, geo_hash])

      _ ->
        :noop
    end
  end

  def observe_radius_search(radius) do
    Histogram.observe([name: :elixir_app_radius_search], String.to_integer(radius))
  end
end
You’ll probably notice that we make use of a function call to Geohash.encode/2 in order to encode the geohash for the
zip code’s lat and long. We’ll need to pull down that dependency by adding an entry to our mix.exs file (make sure to
kill your Docker Compose stack as we are installing a new dependency and run mix deps.get on the host machine to
update the mix.lock file):
defp deps do
  [
    ...
    {:geohash, "~> 1.0.0"}
  ]
end
We’ll also need to add the get_zip_code_info/1 function to our zip codes context. The implementation of that function
is (be sure to also add the import Ecto.Query line at the top):
defmodule ElixirMonitoringProm.ZipCodes do
  alias ElixirMonitoringProm.{Repo, ZipCodes.ZipCode}

  import Ecto.Query

  ...

  def get_zip_code_info(zip) do
    Repo.one(from zip_code in ZipCode, where: zip_code.zip_code == ^zip)
  end

  ...

end
Now that the implementations for the two pieces of data we want are in place, we’ll need to invoke the
observe_radius_search/1 and increment_zip_code_search/1 functions from our controller to keep track of the stats
(for the purposes of this tutorial this will suffice, but for a production application you may not want to introduce
additional latency to your API by having to make an additional DB call). Open up
lib/elixir_monitoring_prom_web/controllers/brewery_controller.ex and add the two Metrics module calls to the
index/2 function (make sure you also update the alias up at the top):
alias ElixirMonitoringProm.{Breweries, Metrics}

def index(conn, %{"zip_code" => zip_code, "mile_radius" => radius}) do
  results = Breweries.get_breweries_in_radius(zip_code, String.to_integer(radius))
  Metrics.increment_zip_code_search(zip_code)
  Metrics.observe_radius_search(radius)

  json(conn, results)
end
Our last step is to initialize the metrics during application startup in the lib/elixir_monitoring_prom/application.ex
file. Add the following line after the other prometheus initialization steps:
def start(_type, _args) do
  ...

  ElixirMonitoringProm.Metrics.setup()

  children = [
  ...
end
With all that in place, start the Docker Compose stack one last time. Once you see the following lines:
elixir_app_1         | [info] Running ElixirMonitoringPromWeb.Endpoint with cowboy 2.6.3 at 0.0.0.0:4000 (http)
elixir_app_1         | [info] Access ElixirMonitoringPromWeb.Endpoint at http://localhost:4000
Navigate to Grafana at localhost:3000 and go to the Brewery Search dashboard. Once there, in a terminal run the
stress tester again via elixir stress_test.exs and see the magic unfold (the gif screen record below has been sped up,
but your should be refreshing every 5 seconds)!
Closing thoughts
Well done and thanks for sticking with me to the end! We covered quite a lot of ground and hopefully you picked up a couple of cool tips and tricks along the way. In Part 2 of this tutorial we covered how to setup Prometheus and Grafana within a Docker Compose stack. We also got Prometheus to fetch metrics from our Phoenix application and even added 2 of our own business related metrics. We even threw together a quick stress tester using Erlang’s built in HTTP client. As you can see, getting your application to expose metrics is not too difficult and can yield many rewards. We didn’t have a chance to deep dive into Grafana or Prometheus this time around, but perhaps next time!
Some caveats I would like to discuss before closing out. When dealing with time series data, it is recommended to not have labels with a high cardinality. We kinda broke that rule given that our zip code search metric has the zip code itself as a label which means we the possibility of having 700+ time series data points to track. Of course this is a tutorial and we are allowed to take some short cuts (mostly to make some cool visuals). If you were to track something geographically like this, I would recommend dealing with a data space of no more than 200 (i.e use countries or states as labels). Especially make sure not to use unbounded values as labels like user IDs or your Prometheus instance is going to have a bad time. We also did not cover how to get a stack like this ready for a production environment, so make sure you do your due diligence when trying to do this in a production setting.
One last point I would like to cover is how monitoring differs from logging. While we could have accomplished something similar using a logging solution like ELK and counted various log entries with some sort of pattern. In my experience, it is a lot easier to maintain a codebase where metrics are an explicit call (versus an implicit log statement which is aggregated elsewhere) and it is a lot less stress and noise on your logging solution if it only focuses on dealing with log events. In addition, given that Prometheus (and other monitoring databases for that matter) are fundamentally time series databases, ELK won’t be able to compete in terms of query performance when you are exploring data in your dashboards. As a result, it is best to use each tool for its specific use case. Keep application and system event logs in your logging solution, and use a monitoring solution for application and system metrics.
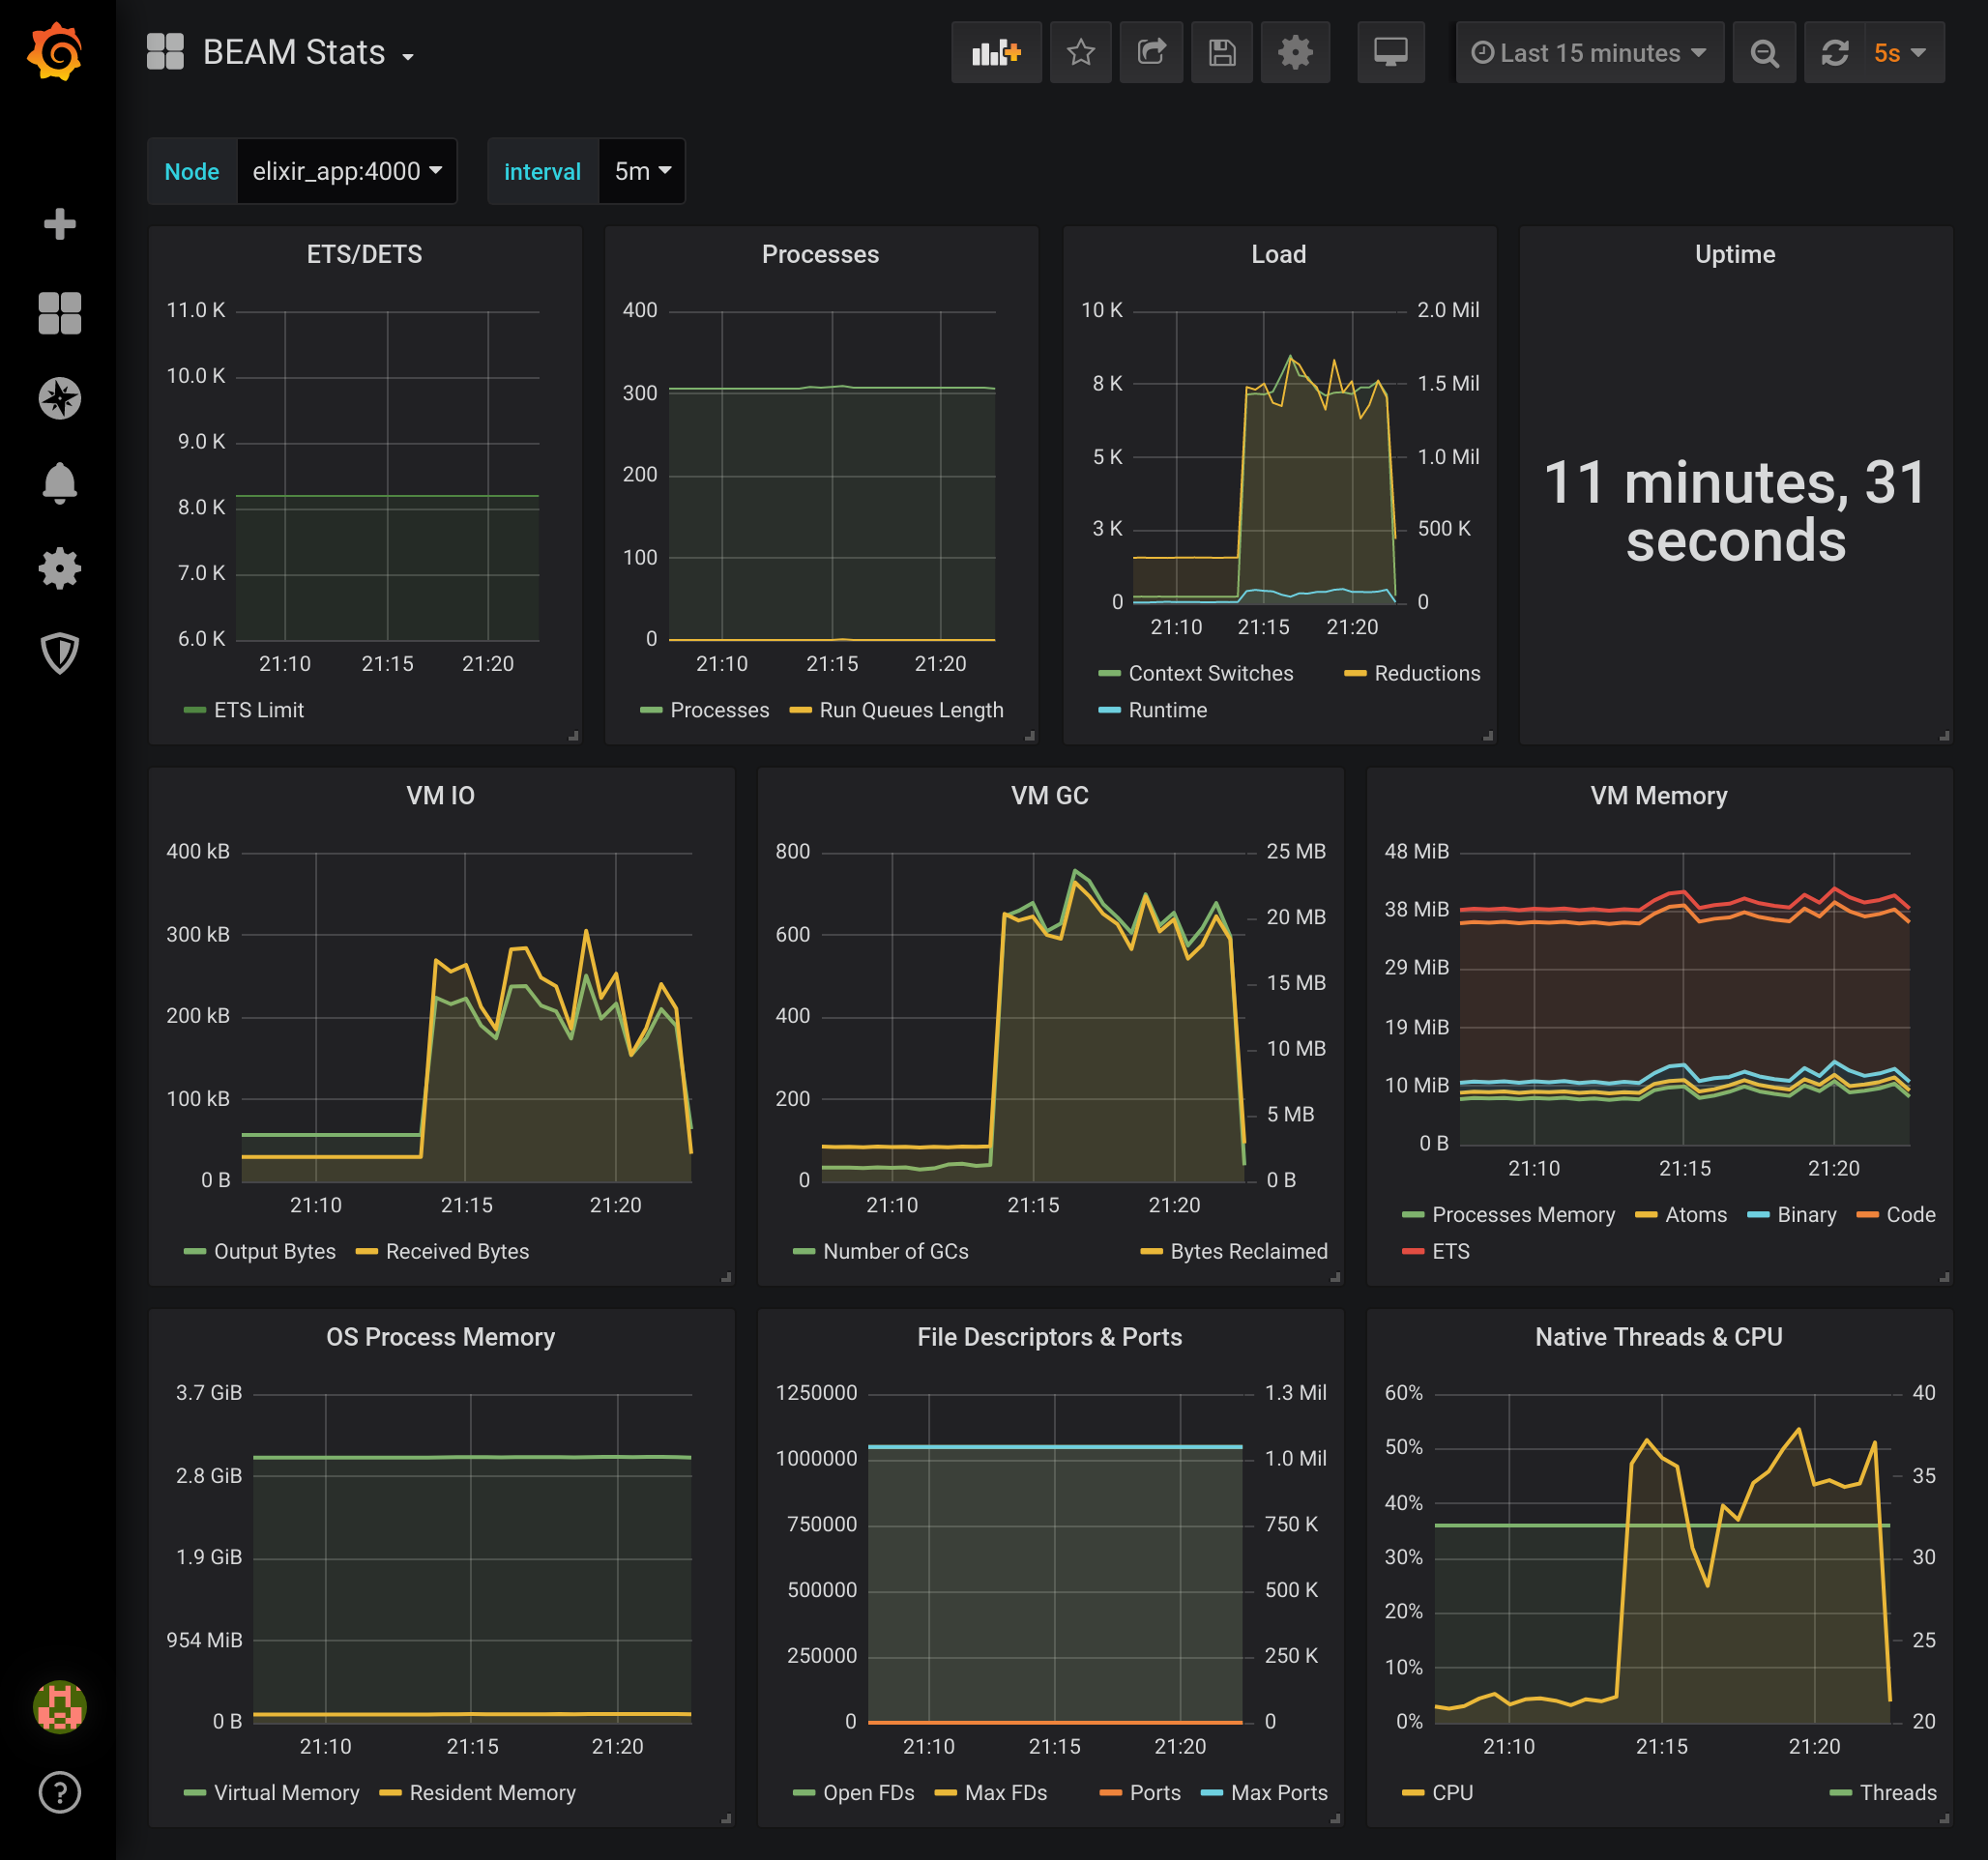
As a reward for making it this far, I’ll give you a bonus and show you the BEAM dashboard during the stress test :).
Feel free to leave comments or feedback or even what you would like to see in the next tutorial. Till next time!
Additional Resources
Below are some additional resources if you would like to deep dive into any of the topics covered in the post.
- [1] https://prometheus.io/docs/introduction/overview/
- [2] https://prometheus.io/blog/2016/07/23/pull-does-not-scale-or-does-it/
- [3] https://prometheus.io/docs/instrumenting/exporters/
- [3] https://github.com/deadtrickster/prometheus.ex
- [4] https://landing.google.com/sre/sre-book/chapters/monitoring-distributed-systems/
- [5] https://grafana.com/blog/2016/01/05/logs-and-metrics-and-graphs-oh-my/
- [6] https://www.oreilly.com/library/view/anomaly-detection-for/9781492042341/ch04.html
- [7] https://logz.io/blog/logs-or-metrics/
- [8] https://prometheus.io/docs/concepts/metric_types/
comments powered by Disqus