Contents
Intro
In this post we’ll talk about what what exactly error monitoring is, why you need it in your production application, and what tools are available in the space. Finally, we’ll go over setting up a self hosted error monitoring solution for a sample Phoenix application. Without further ado, let’s dive right into things!
What is error monitoring?
Error monitoring is the practice of monitoring your application for errors or unhandled exceptions. This differs from logging with ELK or monitoring with Prometheus in that it is meant to trap exceptions, give you the context necessary to understand how the error was triggered, and notify you as to how often the error is occurring. With Prometheus or ELK you may see the 500 responses or error log statements, but getting details like how often the problem is occurring or under what circumstances is a bit more work for you as the developer.
Why use an error monitoring solution?
Leveraging an error monitoring tool in your production system allows you as the developer to track down errors as they occur and to have the information necessary to reduce the time it takes to fix the problem (this is also called MTTR or Mean Time To Repair). Let’s face it, now matter how hard we try, bugs will make their way to production. The best thing we can do for our team and organization is to have tools at our disposal which allows us to quickly fix the problem and ensure that customer impact is minimal. As we’ll see in our sample application, setting up an error monitoring solution is not too difficult, does not introduce excessive performance overhead, and can help us immensely when things don’t go as expected.
For this sample application we will be using Sentry (https://sentry.io) as the Elixir client is well supported and Sentry allows us to self host the error monitoring stack. You can also sign up for Sentry’s SaaS offering if you prefer to have a managed service. Other vendors in the error monitoring space include but are not limited to: Bugsnag (https://www.bugsnag.com), Rollbar (https://rollbar.com), and Raygun (https://raygun.com/).
Show me the code!
Step 1: Create a new Phoenix project - commit
Install the Phoenix project generator.
$ mix archive.install hex phx_new 1.4.9
Generate a new project. You can replace sentry_sample_app with whatever your project is called and can also
re-enable ecto and webpack if your app requires it.
$ mix phx.new sentry_sample_app --no-ecto --no-webpack
In order to ensure that everything works, switch into the project directory and start the server.
$ cd sentry_sample_app
$ mix phx.server
If all goes well you should see the default Phoenix homepage when you navigate to http://localhost:4000.
Step 2: Add some dummy endpoints - commit
In order to make our application more interesting, we’ll add an endpoint which we will use to perform some basic math
operations. Inside of lib/sentry_sample_app_web/router.ex change the default scope block from
scope "/", SentrySampleAppWeb do
  pipe_through :browser

  get "/", PageController, :index
end
to
scope "/math", SentrySampleAppWeb do
  pipe_through :api

  post "/", MathController, :create
end
Next we’ll need to create the MathController and the create handler function. Create the MathController at
lib/sentry_sample_app_web/controllers/math_controller.ex and add the following code (please note that this controller
is very much sloppily put together as the purpose of this exercise to get familiar with Sentry and not to write a
perfectly RESTful API):
defmodule SentrySampleAppWeb.MathController do
  use SentrySampleAppWeb, :controller

  def create(conn, %{"function" => "add", "val_1" => val_1, "val_2" => val_2}) do
    conn
    |> json(%{result: val_1 + val_2})
  end

  def create(conn, %{"function" => "div", "val_1" => val_1, "val_2" => val_2}) do
    conn
    |> json(%{result: val_1 / val_2})
  end

  def create(conn, %{"function" => "mult", "val_1" => val_1, "val_2" => val_2}) do
    conn
    |> json(%{result: val_1 * val_2})
  end
end
And with that, our super awesome math SaaS company is well on its way! We can test our application by starting the server and making a curl call against it:
# In one terminal
$ mix phx.server

# In another terminal
$ curl -d '{"function": "add", "val_1": 5, "val_2": 9}' \
> -H "Content-Type: application/json" \
> -X POST http://localhost:4000/math
{"result":14}
As we can see, our application is up and running and is returning the correct result in this particular case. Hurray! Unfortunately, we’ve been getting customer complaints that sometimes our API returns 500s. Let’s setup Sentry to see if we can get some insight into why this may be happening.
Step 3: Setup Sentry docker-compose stack
Luckily Sentry makes it very easy to get started by hosting your own instance of the Sentry error monitoring stack.
We’ll start off by cloning the docker-compose repo that Sentry provides at https://github.com/getsentry/onpremise and
then initializing the docker-compose stack (you can clone this repo in another directory outside of
sentry_sample_app). When the installation script asks you to create a user account do so.
$ git clone https://github.com/getsentry/onpremise.git
$ cd onpremise
$ ./install.sh
Once the installation is complete, you can bring up the docker-compose stack by running the following code. Once the
docker-compose stack is up and running, navigate to http:/localhost:9000/ to complete the setup process.
$ docker-compose up
After pressing Continue from the “Welcome to Sentry”, we’ll want to create a new Sentry project to capture errors for
our Phoenix application. In the upper right hand corner click on Add new... and select Project. From there select
Elixir from the Server category. Give your Sentry project a name (in this case sentry-sample-app) and click the
Create Project button. You can skip the installation instructions on the project page as we’ll cover that in the
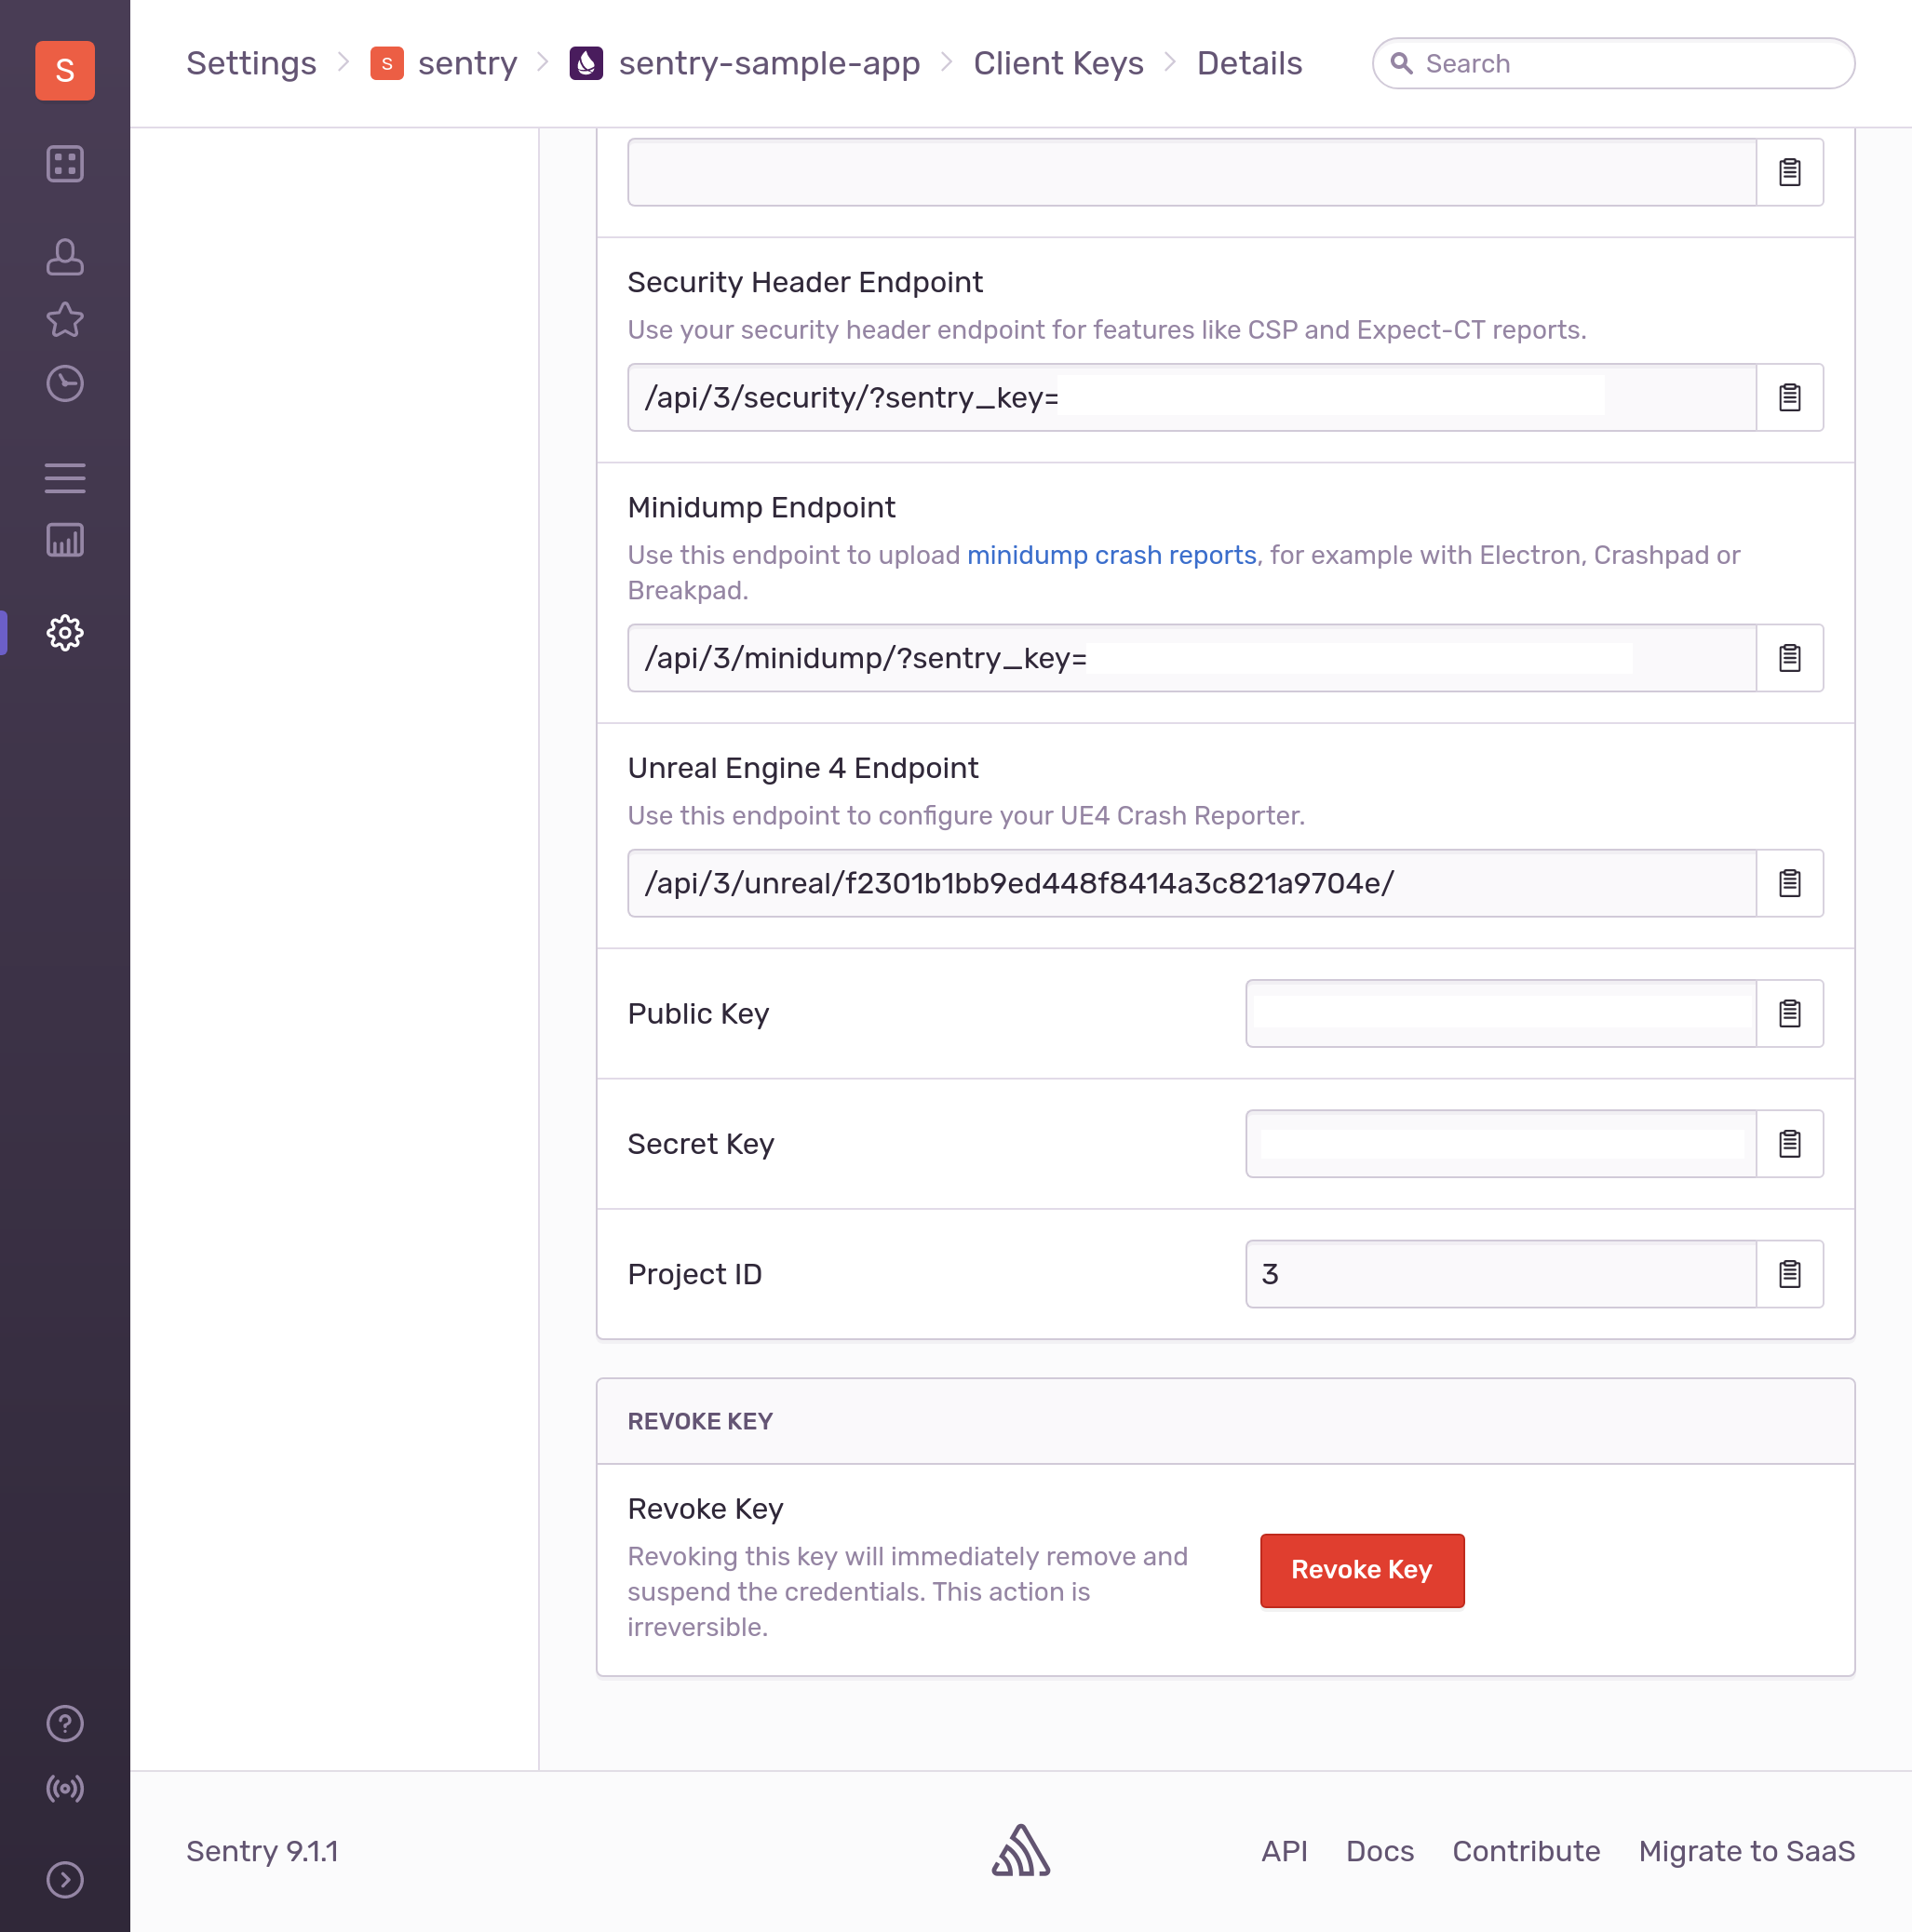
following step. Instead, go to the project page http://localhost:9000/sentry/sentry-sample-app/ and proceed to
Settings. From there click Client Keys (DSN) and then, for the default entry click Configure. At the bottom, take
note of the Public Key and Project ID. We’ll need those for the next section. As a general rule with secrets and
sensitive information, do not commit these to source control but rather inject them into your application via
environment variables.
Step 4: Setup Sentry client in Phoenix app - commit
Now that we have Sentry up and running on our machine, it is time to hook up our Phoenix application to Sentry so that
we can capture any unexpected errors. To begin, we’ll need to add some dependencies to our mix.exs file. Our deps()
function should look like this:
defp deps do
  [
    {:phoenix, "~> 1.4.9"},
    {:phoenix_pubsub, "~> 1.1"},
    {:phoenix_html, "~> 2.11"},
    {:phoenix_live_reload, "~> 1.2", only: :dev},
    {:gettext, "~> 0.11"},
    {:jason, "~> 1.0"},
    {:plug_cowboy, "~> 2.0"},
    {:sentry, "~> 7.0"}
  ]
end
After adding Sentry to the mix.exs file, go ahead and run mix deps.get from the terminal to fetch the new
dependencies. Next we’ll need to add some use statements to our Router and Endpoint modules.
In lib/sentry_sample_app_web/router.ex add the following after use SentrySampleAppWeb, :router:
use Plug.ErrorHandler
use Sentry.Plug
By adding these, Sentry will be able to handle errors that occur after the Router is invoked. In order to properly
capture errors prior to the Router, we need to make changes to the Endpoint modules. The Endpoint module can be found at
lib/sentry_sample_app_web/endpoint.ex and we’ll need to add the following after use Phoenix.Endpoint, otp_app: :sentry_sample_app:
use Sentry.Phoenix.Endpoint
These are not the only bits of functionality offered by the Elixir Sentry package. You can also manually submit an error
to Sentry by calling Sentry.capture_exception/2 and you can also capture all non Phoenix/Plug related errors by
updating your lib/sentry_sample_app/application.ex file and including the following:
{:ok, _} = Logger.add_backend(Sentry.LoggerBackend)
The final step will be to configure our application to send errors to our locally hosted Sentry stack. To do so, we need
to add the following to our config/config.exs, replacing the <PUBLIC_KEY> and <PROJECT_ID> with the values that we got
at the end of the previous step (in a production environment we would configure this via environment variables through
Distillery or Elixir 1.9 releases):
config :sentry,
  dsn: "http://<PUBLIC_KEY>@localhost:9000/<PROJECT_ID>",
  enable_source_code_context: true,
  root_source_code_path: File.cwd!(),
  included_environments: [:dev],
  environment_name: Mix.env()
Step 5: Seeing your errors in Sentry - commit
Now that we have our application instrumented with Sentry, we can make some requests against our API and see what
happens. In order to have access to the project source code in Sentry, we’ll need to force compile Sentry and start our
server (you can also add an alias to your mix.exs file to streamline this as done in the commit for this step).
$ mix deps.compile sentry --force
$ mix compile
$ mix phx.server
Once your Phoenix app is up and running, you can make the following request to your API via curl:
$ curl -d '{"function": "div", "val_1": 5, "val_2": 0}' \
> -H "Content-Type: application/json" \
> -X POST http://localhost:4000/math
In the terminal you should get back a dump of HTML which is from the Phoenix debug errors option debug_errors (more
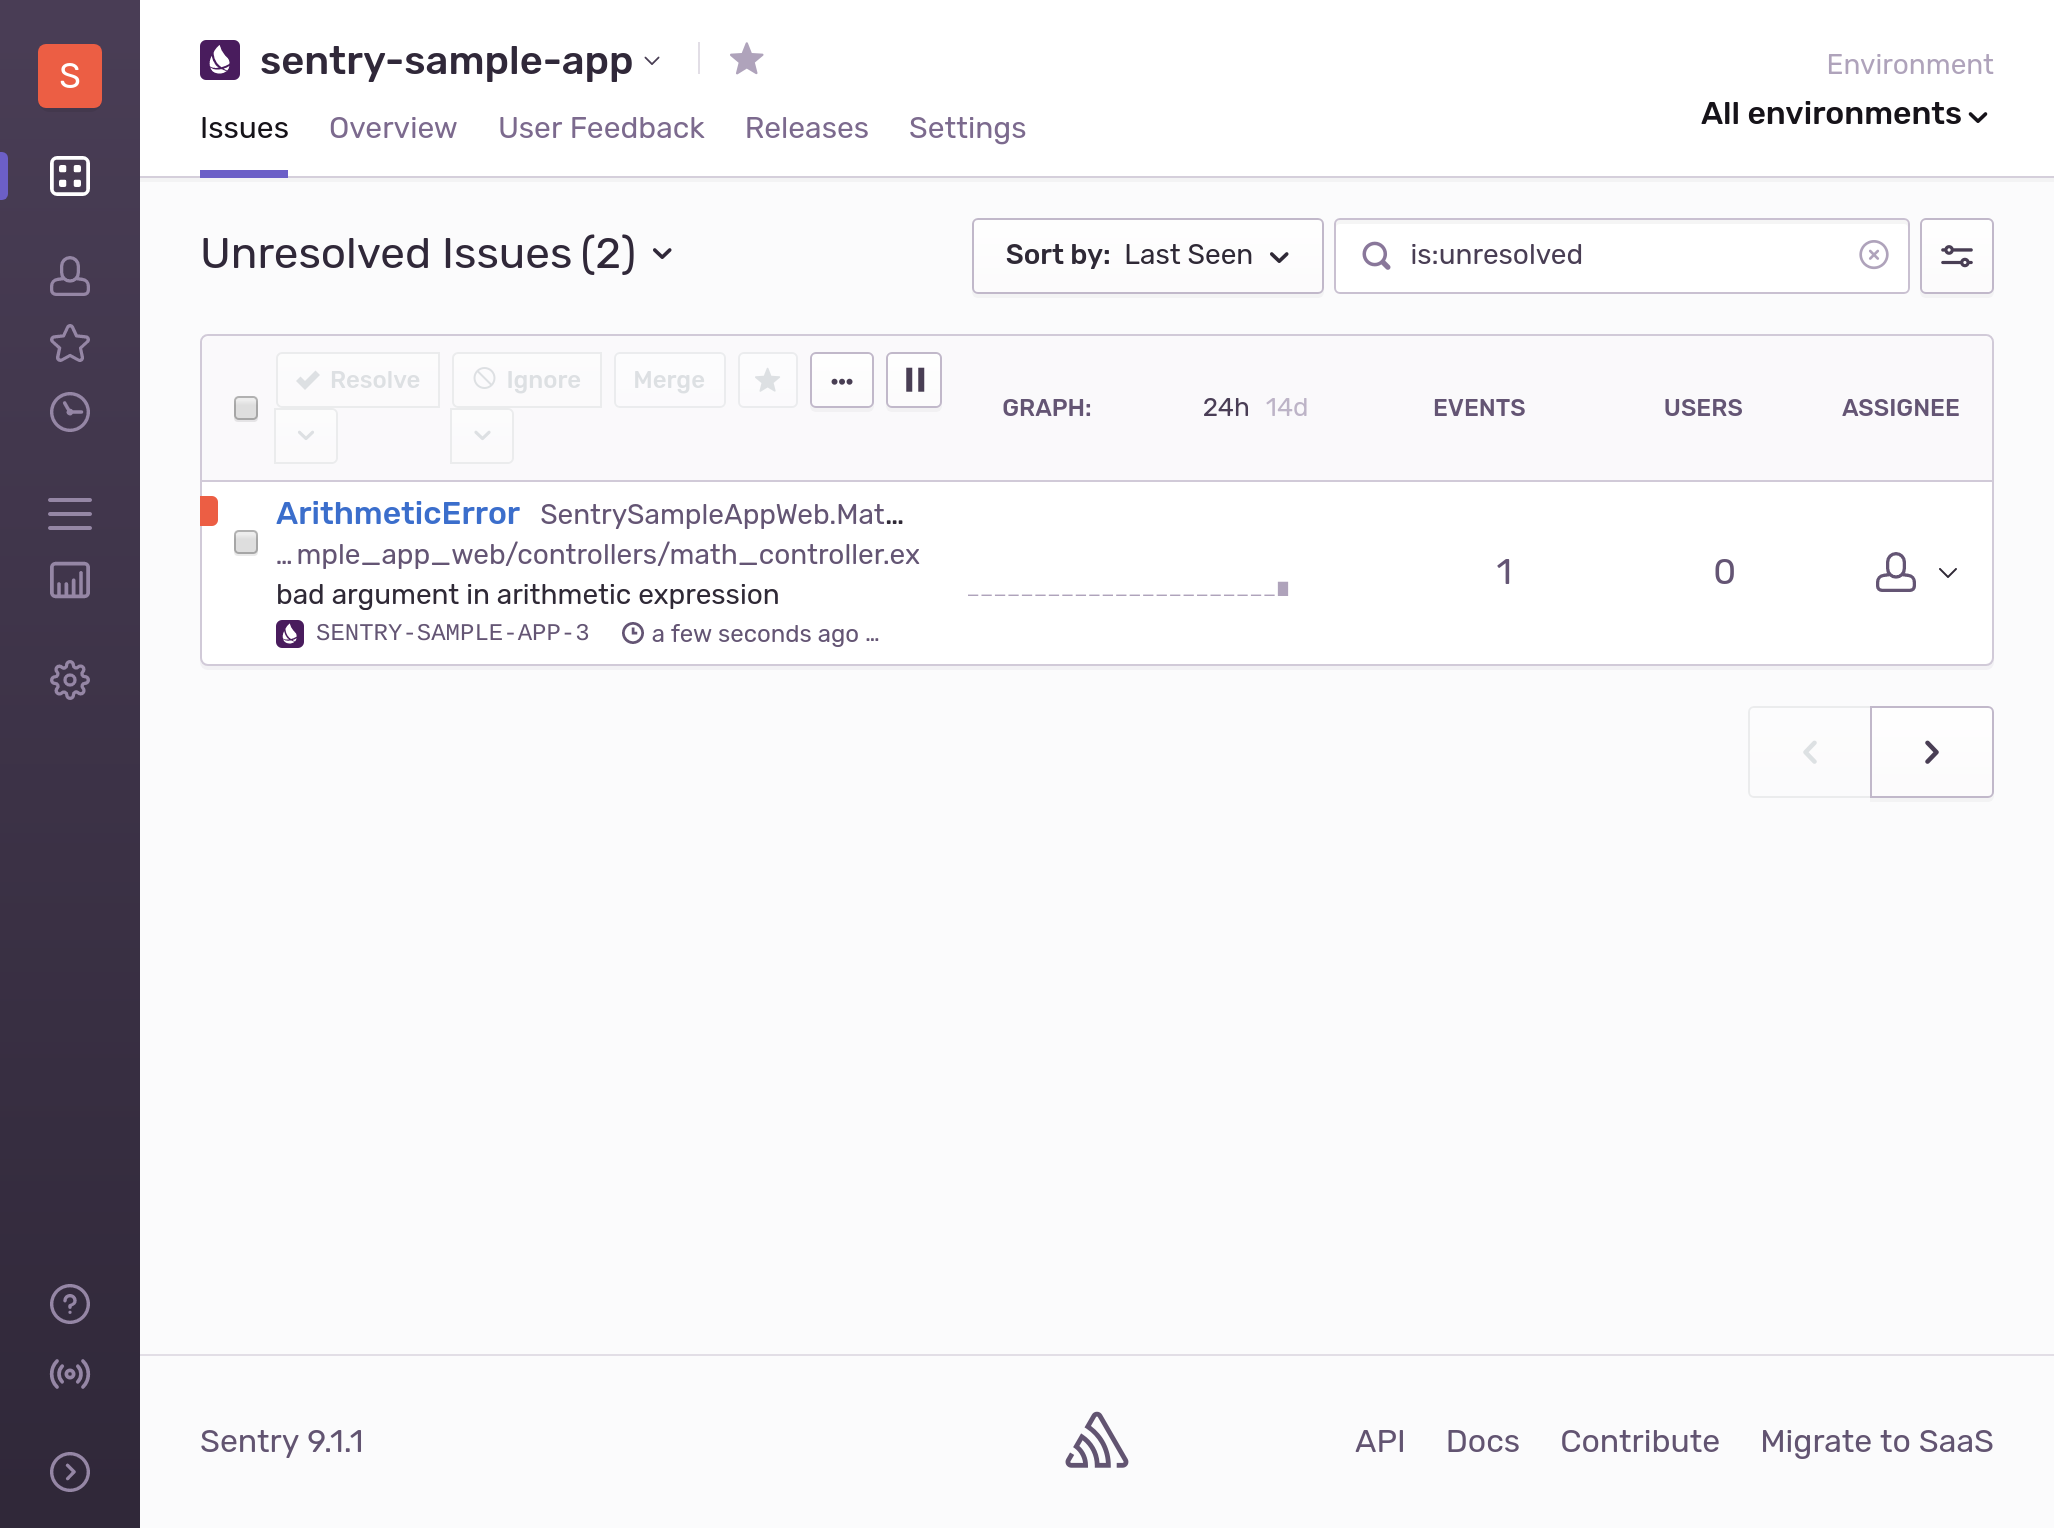
details can be found here https://hexdocs.pm/phoenix/errors.html). That aside,
if you look at Sentry under the sentry-sample-app Project, you should see an ArithmeticError entry which should help us
determine what the error is that has been pestering our users.
If we click into that error we will see all sorts of information related to the request that triggered the error. For example, we can see the snippets of the code as they relate to that stacktrace, what the request parameters were, how many times this has happened, how many users it has impacted, the browser that made the request and the frequency of the error to name a few.
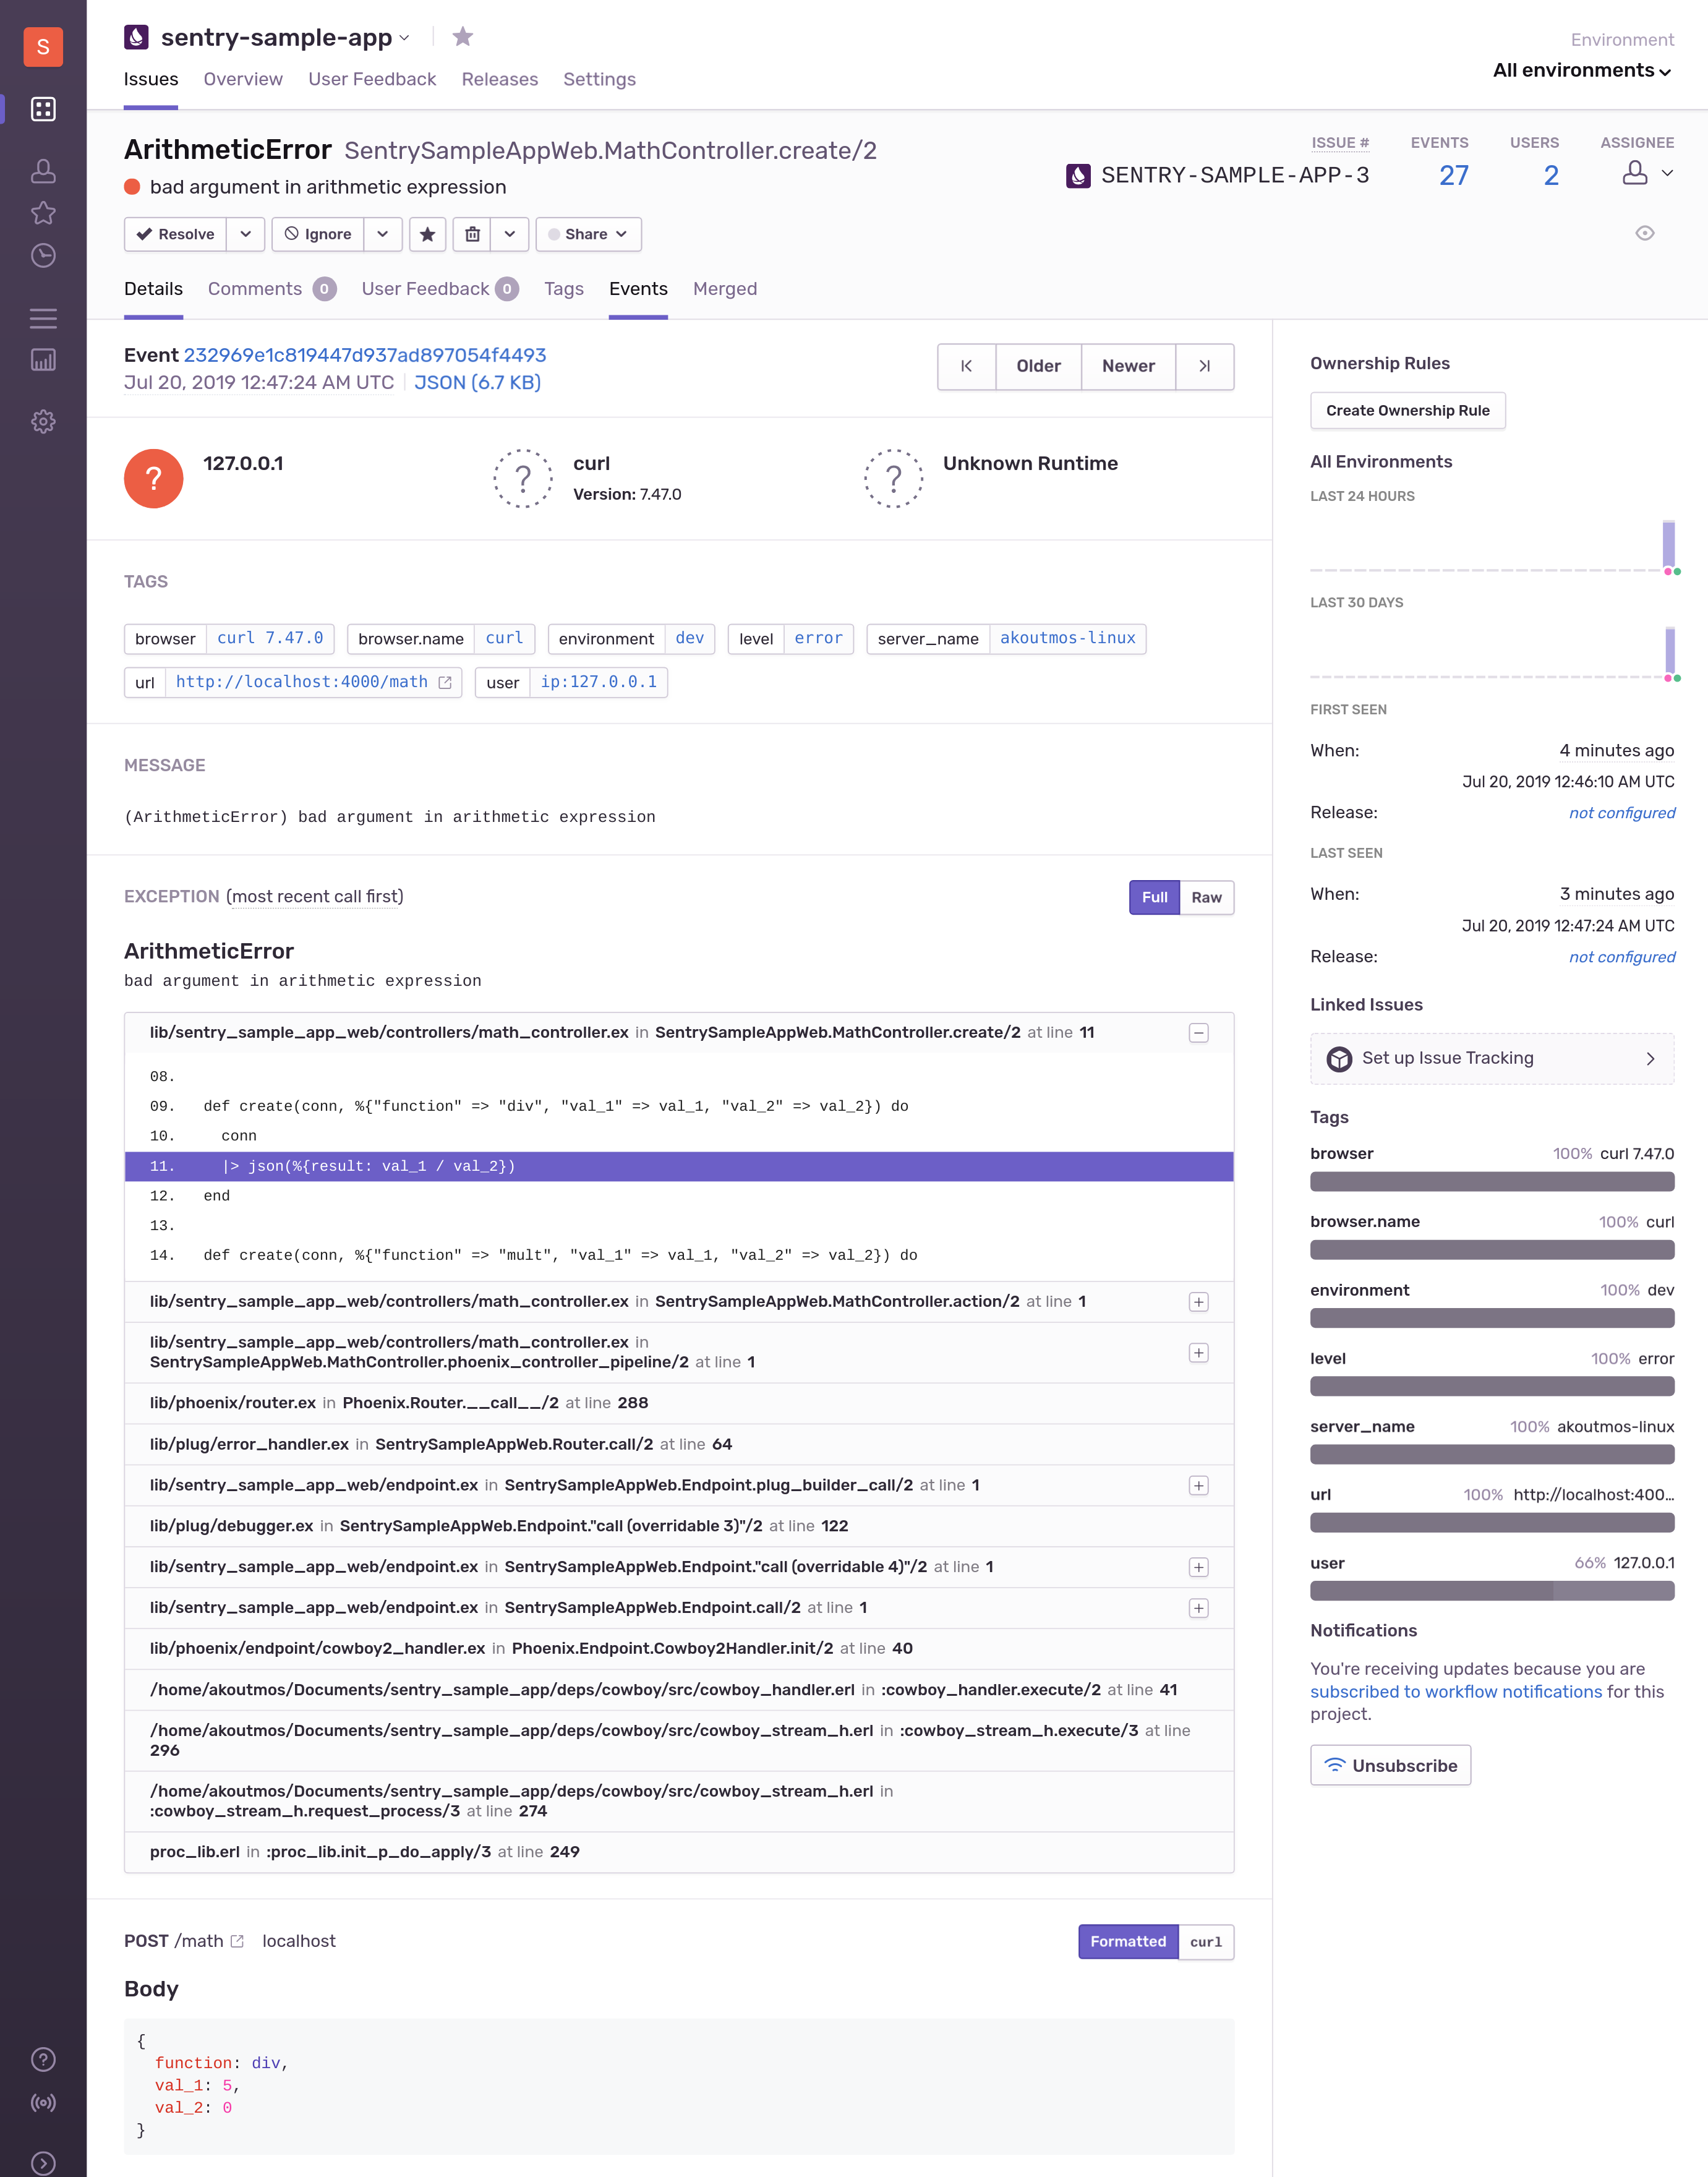
As we can see from the error event, our error occurred when our API received the following payload:
{
  "function": "div",
  "val_1": 5,
  "val_2": 0
}
We can now go back to our application and fix the problem (perhaps by not allow division by zero) and add a test to ensure that this error is not reintroduced in the future.
Closing thoughts
Well done and thanks for sticking with me to the end! We covered quite a lot of ground and hopefully you picked up a couple of cool tips and tricks along the way. In this tutorial we went over how to leverage Sentry error monitoring within our Phoenix application so that we could track down and fix errors. As you can see, by having a dedicated error monitoring solution in place, we can collect all the necessary information in order to quickly fix the error and minimize the customer impact.
Feel free to leave comments or feedback or even what you would like to see in the next tutorial. Till next time!
Additional Resources
Below are some additional resources if you would like to deep dive into any of the topics covered in the post.
- https://docs.sentry.io/clients/elixir/
- https://github.com/getsentry/sentry-elixir
- https://github.com/getsentry/onpremise
- https://sentry.io/vs/logging/
comments powered by Disqus